Timelines are fantastic story-telling tools to use in presentations. They allow us to visualize significant milestones, key events, and incidents over time in one easy-to-digest format. When creating timelines, most PowerPoint users opt to use SmartArt. The thing is, SmartArt is boring! If you want to connect with your audience, you need something simple, practical and beautiful. That’s why I’m going to walk you through the step-by-step process of creating the ultimate PowerPoint timeline graphic (from scratch). We’re going to be using different colors, icons, shapes and text boxes. The best part? We’re going to convey one timeline over multiple slides.
Step 1: Set up the Powerpoint Timeline Graphic
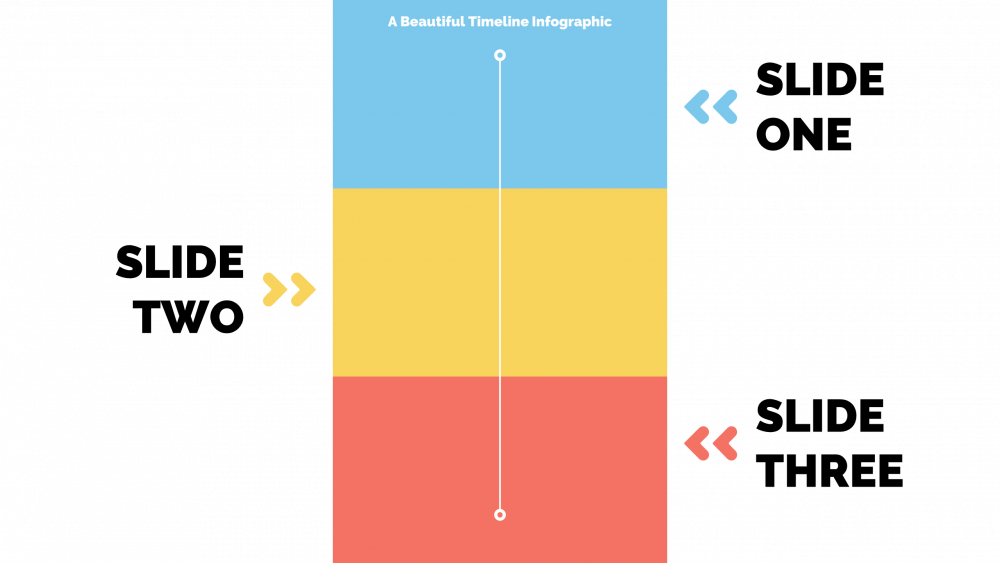
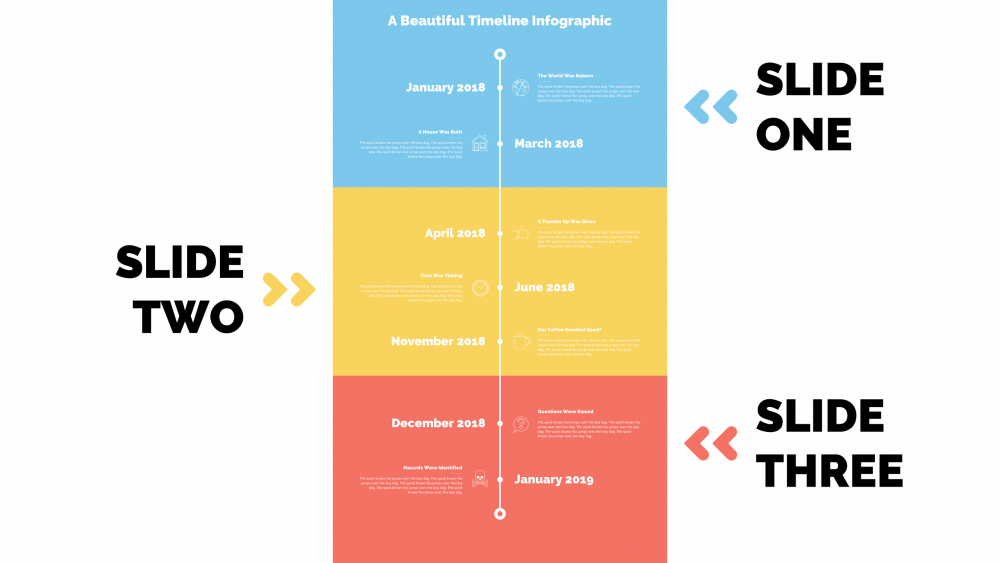
First things first, you have to decide on how many slides you want for your timeline graphic. For this tutorial, we’re going to use three different slides to make sure the timeline graphic flows seamlessly.
Once you have your slides, I recommend adding a colored background to each. You can do this by going to any slide, right-clicking the slide canvas, and clicking Format Background. Go ahead and choose a color that best represents your message. I went with blue, yellow and red for mine. Of course, you don’t have to add any colors to the background at all. But adding some contrast to your slide is a great way to drive your point home.

Once you’re satisfied with the slides’ backgrounds, it’s time to add a header. You’re going to use a text box to do this. This text box will be the heading for the entire PowerPoint timeline graphic. As such. you should only do this for the first slide
Go to the first slide, click on the Insert tab, then click on Text Box.
Type in whatever heading you’d like, customize it with your choice of font and size, and align it to the center. Be sure to place this text box in the upper area of your slide.
The time has come to set up the structure of the PowerPoint timeline graphic. Go to the Insert tab, click Shapes, then click on the Circle: Hollow symbol.
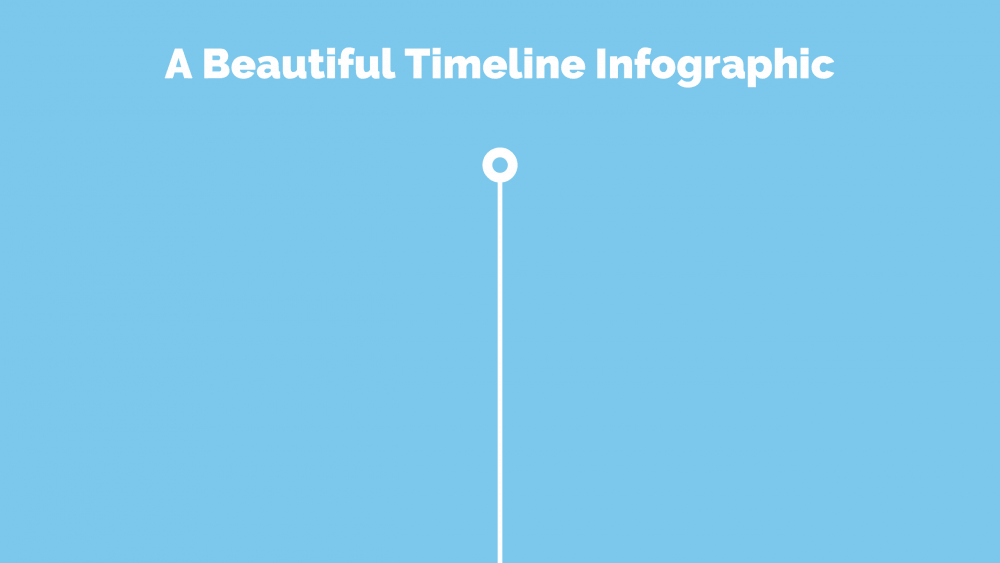
Draw out a small hollowed circle in the upper area of your slide, color it white and remove the outline. Make sure there is a noticeable gap between the ring and the title.
Click Shapes again, and this time click on the Line symbol. Draw out a line going down your slide, with the starting point being just underneath the hollowed circle. Make sure the line is white, too. Feel free to add some thickness to it by going to Format > Shape Outline > Weight > 4.5 points.
Go ahead and apply the actions outlined above to your other slides. Just be aware of two things:
- Ensure you identified a start, middle, and end of the whole PowerPoint timeline graphic. In my example, the ring in the first slide signifies the start point, the line drawn downwards highlights the middle, and the ring in the last slide brings everything to a close.
- Aim for consistency. Get the line and circles to follow the same position, path, color, and thickness as illustrated in the first slide.
You should end up with something that looks like this.
Step 2: Create One Milestone (With a Date)
Milestones highlight a significant stage or event in your PowerPoint timeline graphic. They are the critical components of your message, so it’s important to do things right.
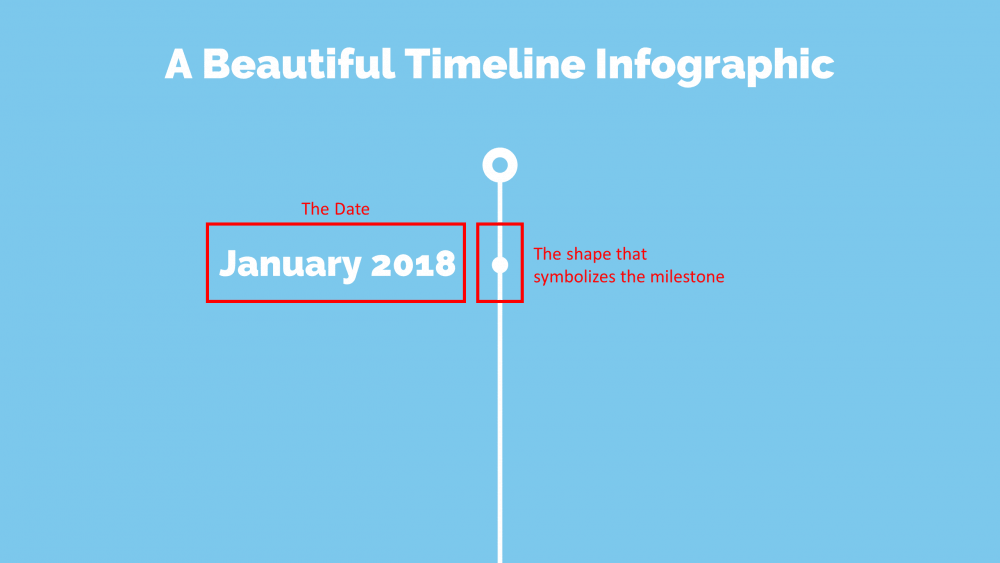
Go to the Insert Tab, click on Shapes, and then click the Oval symbol. Draw out an evenly-sized circle and place it on your timeline. Just like the first step, remove the outline and color it white.
While you’re still on the Insert tab, click on Text Box and position the element on the left side of the circle. Type in the date for the milestone, increase the font size to something noticeable and align it to the right.
Step 3: Expand on the Milestone
So we have our first milestone on the PowerPoint timeline graphic. Awesome. Now, we’re going to expand on it by adding an icon, a sub-heading, and some text.
The critical thing to note here is that all three components have to talk to one another. You want a sub-heading that gives insight to the milestone, a bit of text to expand on the sub-heading, and an icon that visually ties everything together.
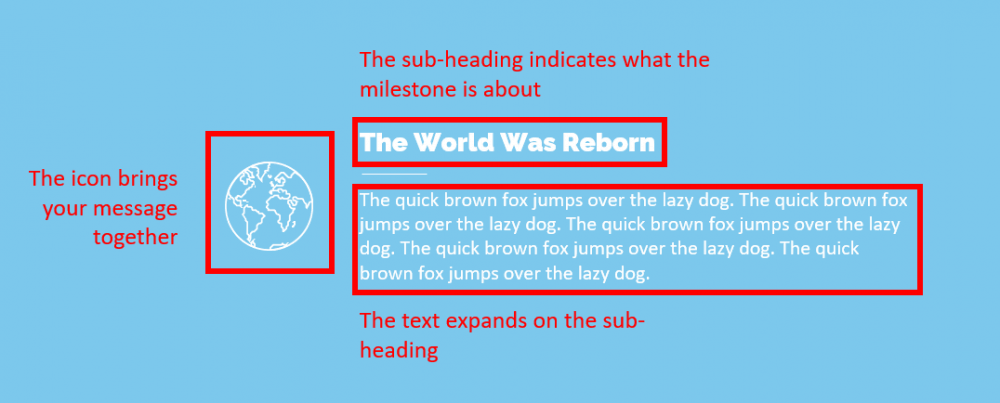
Make sure you position these elements as shown in the figure above (notice how everything is aligned to the left). When you’re happy with the way everything looks, group them up by highlighting all the components and then press Ctrl + G.
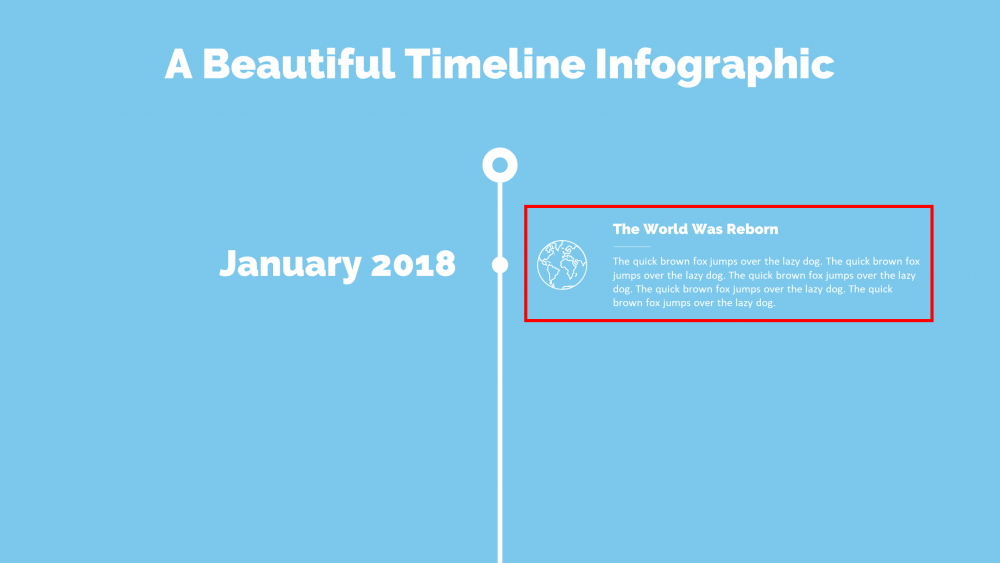
To finish off this step, position your grouped element on the right side of milestone’s circle.
By the way, I used Slide Cow’s Business Casual PowerPoint template for my icons. There are over 295 fully editable ones in there. If you need beautiful icons, and you need them now, then consider checking it out.
Step 4: Repeat Steps 2 and 3 to Continue the Timeline
You should now have a milestone that is both beautiful and informative. Great work! Now, you’re going to use that same milestone as a reference point for all the other events.
Highlight everything that makes up your first milestone (the date, the circle, and the grouped element) and press Ctrl + G to group it up.
With your grouped milestone now selected, hold down Ctrl + Shift + Left Mouse Button and drag your mouse down. You should end up with another milestone that is an exact replica of the first.
Select your second grouped milestone (the one you just made), go to the Home tab, click Arrange > Rotate > Flip Horizontal.
Click on the element you just rotated and hold the left arrow key until you position the circle (the one that signifies the milestone) in the middle of your timeline.
This part is a little tricky, so refer to the GIF below for further support. I want you to align the text in your second milestone in the opposite direction set out in your first. Remember how the date in the first milestone was aligned to the right? Align the text in your second milestone to the left. Similarly, your sub-heading and text boxes are going to be aligned to the left, and not the right.
Assuming you’re finished with formatting and positioning, it’s time to start adding your message. Change the date, icon, sub-heading, and text in your second milestone to whatever you want.
Congratulations, you can now repeat this step as many times as you want for all of your slides.
Step 5: Polish It All up with a Push Transition
In PowerPoint, slide transitions are cosmetic ways to move from one slide to the next. With a Push Transition, the incoming slide is being ‘pushed’ into the frame, thereby forcing your previous slide out of the way.
Putting it into practice, you’re going to hold the Control Key and select everything except the first slide. Now, go to the Transitions tab and click the Push transition.
You’re done! To make sure everything works, hit the F5 Key to go into Slide Show mode and watch your beautiful PowerPoint timeline graphic come to life.
That’s a Wrap!
In this tutorial, you learned five simple steps to create a compelling PowerPoint timeline graphic over three slides. If you liked the material, please let us know by sharing it with your friends and colleagues.
Also, if you’re facing any problems, just let me know by posting in the comments section below. I’m here to help!

Great tutorial! Any suggestions for a 1-page, Landscape timeline with 21 milestones? Dates range from 1970s to the present.
Hey Sally!
In this case, I’d do my best to summarize the data. If that can’t be done, I’d be sure to keep to around 7 milestones per slide and then use 3 slides in total to deliver the message.