How to Make a 3 Point Circle Infographic on PowerPoint
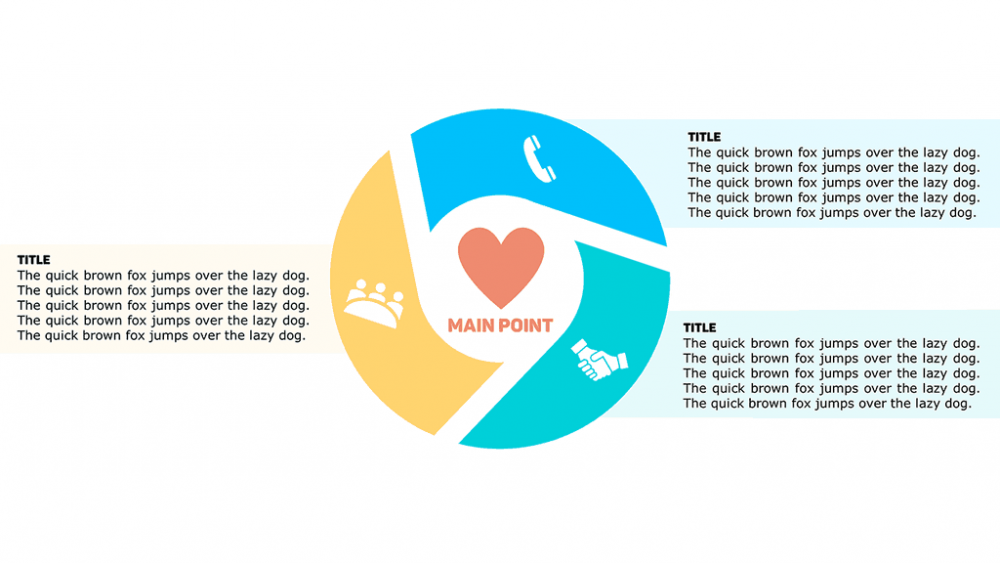
In this week’s PowerPoint tutorial, we’re going to make a 3 Point Circle Infographic on PowerPoint. WHAT IS IT? A 3 point circle infographic, is basically, an infographic with 3 points (shocker). What’s interesting though, is that there is a main point in the middle of the infographic, which correlates to the icons and the […]
Easily Make a Cycle Infographic Using Arrows in PowerPoint
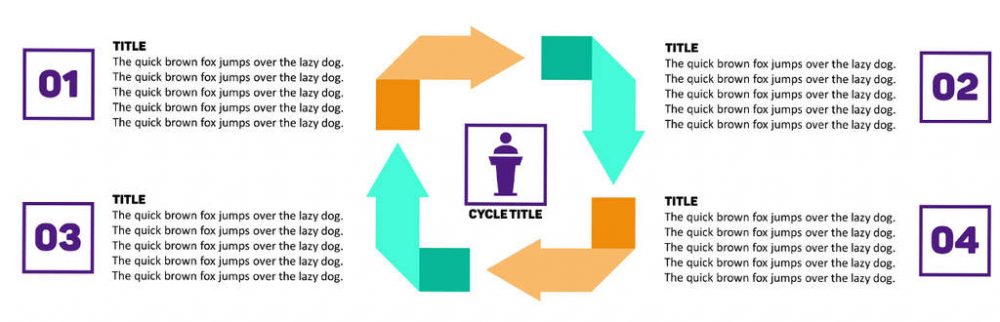
So I’ve been getting tons of e-mails lately asking me how to make a cycle infographic. I love you guys, so I’m going to do exactly that. I will show you exactly what to do to make a cycle infographic that is functional and aesthetically pleasing. How is this different from a process map […]
A Simple Three-Step Process Infographic on PowerPoint That Even Your Grandmother Can Make
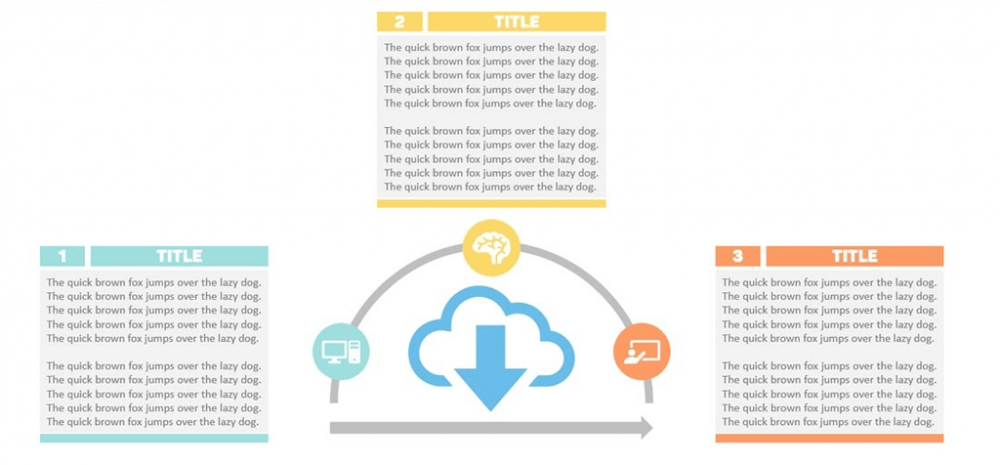
Some time ago, I showed you how to make a step-by-step ribbon model on PowerPoint. Following that trend, we’re going to make an easy three-step process infographic. I think process infographics in PowerPoint are awesome. The reason is pretty straight forward: they make things easier for the audience to understand and this is primarily because the […]
How to Make a Split-Up Cube Infographic on Powerpoint

Let’s create the perfect example of how we can use 2D shapes to create a 3D effect on PowerPoint by making a split-up cube infographic! VIDEO TUTORIAL Make a cube, then cut it up; all in PowerPoint! What the heck is a “split-up cube infographic?”I’m glad you asked that question. I made up the term. But […]
How to Make a Cool-Looking Gear Infographic on PowerPoint
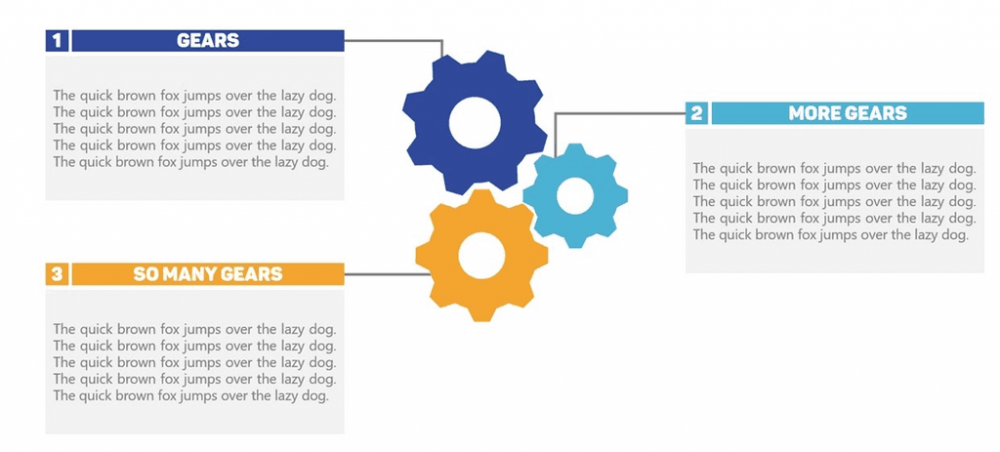
Good morning, afternoon, or evening, depending where you are, to all my fellow PowerPoint enthusiasts. This week’s tutorial is actually going to be super easy, but super effective. I’m going to teach you how to make a gear infographic on PowerPoint! Sometimes, the best PowerPoint slides are also the simplest. This slide in particular uses […]
Here’s A Cool Way to Display Survey Results in PowerPoint
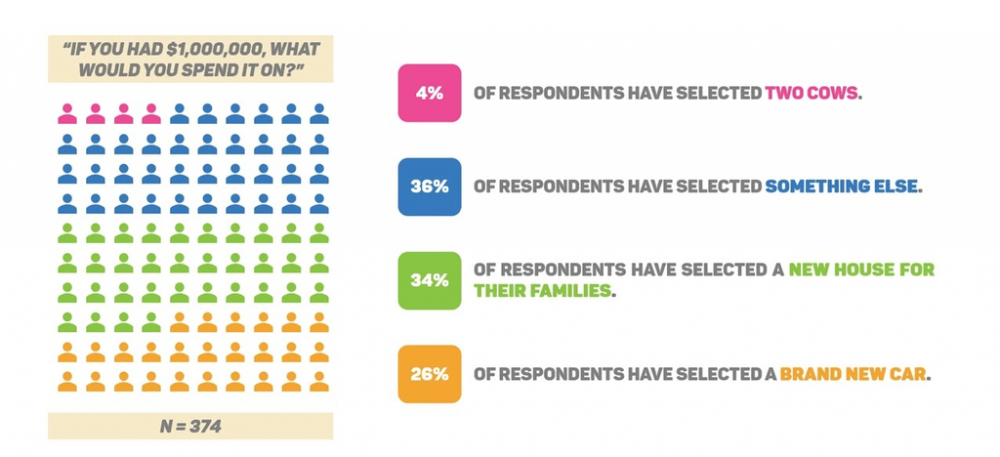
You just conducted a survey. You worked hard on your research. You gathered all these fancy numbers and statistics. You even made an epic analysis that’s about to get you promoted. Now, you’re thinking about presenting that information in a way that’s meaningful. There’s only one problem. You have no idea how to do it. […]