Easily Make a Cycle Infographic Using Arrows in PowerPoint
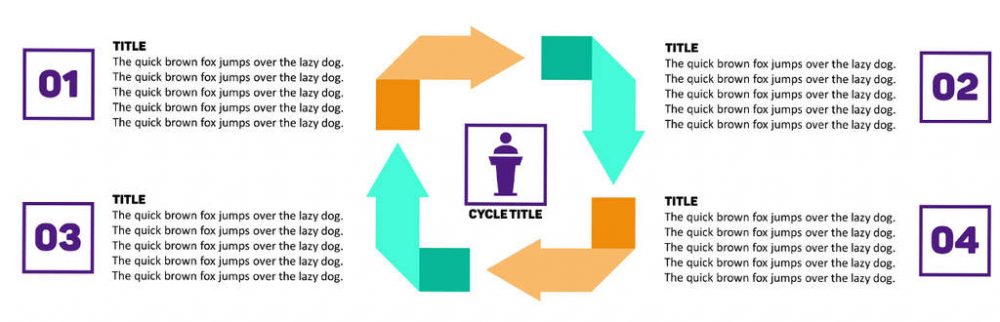
So I’ve been getting tons of e-mails lately asking me how to make a cycle infographic. I love you guys, so I’m going to do exactly that. I will show you exactly what to do to make a cycle infographic that is functional and aesthetically pleasing. How is this different from a process map […]
Make an Awesome Paper Slit Effect for Your Business Models on PowerPoint
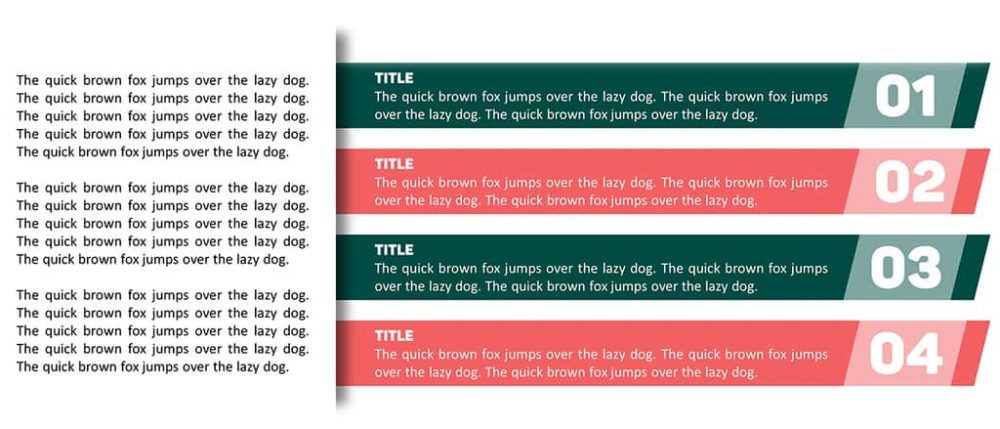
Alrighty fellow PowerPoint soldiers, this week we’re going to learn something really special. We’re going to combine a design technique with a business modeling technique for our PowerPoint slide. In essence, we’re going to create a paper slit effect on PowerPoint. Why a paper slit effect? Honestly? It just looks awesome. I mean, just look […]
Bring More Emphasis to Your Information Using These Arrow Infographics on PowerPoint
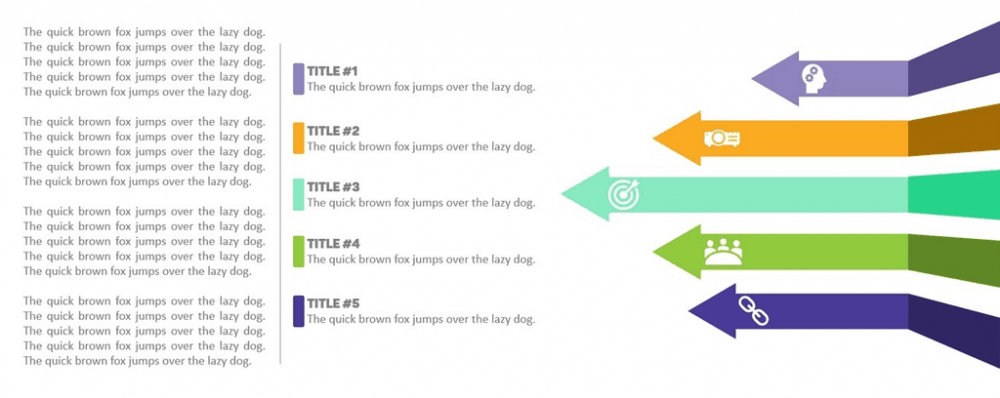
Hello PowerPoint Samurais! This week’s tutorial is going to focus on bringing more attention to your information on your PowerPoint slide; and we are going to do that by creating arrow infographics. Not just any arrow infographics, mind you, but arrow infographics with a cool 3D effect (woop!) Why arrows though? Arrows on PowerPoint slides […]
How to Make a Fun ‘Why We Are Unique’ Slide on PowerPoint (with Sheep!)

In this week’s tutorial, we’re going to make a fun and awesome-looking ‘Why We Are Unique’ slide on PowerPoint using sheep. These kind of PowerPoint slides capture the attention of others in a heartbeat. In essence, we’re going to let the sheep infographic set the foundation of the slide, and allow the supplementing information build […]
How to Make a Split-Up Cube Infographic on Powerpoint

Let’s create the perfect example of how we can use 2D shapes to create a 3D effect on PowerPoint by making a split-up cube infographic! VIDEO TUTORIAL Make a cube, then cut it up; all in PowerPoint! What the heck is a “split-up cube infographic?”I’m glad you asked that question. I made up the term. But […]
Here’s A Cool Way to Display Survey Results in PowerPoint
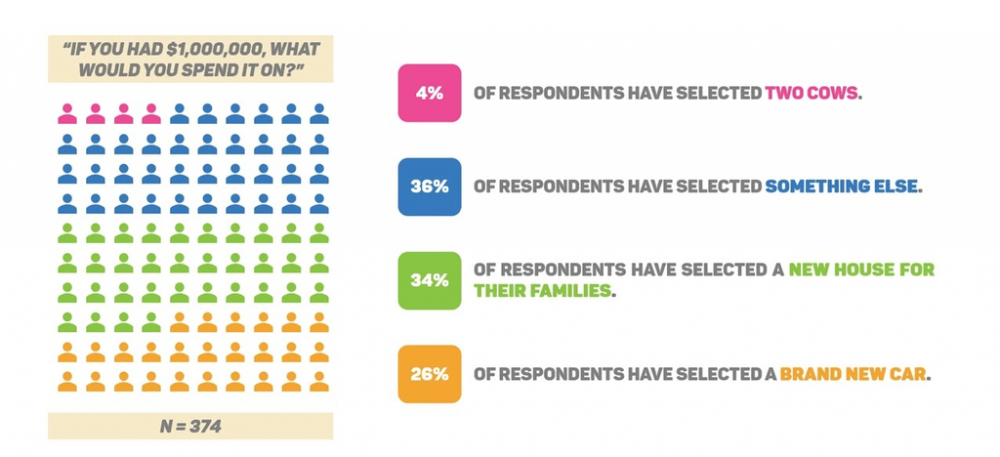
You just conducted a survey. You worked hard on your research. You gathered all these fancy numbers and statistics. You even made an epic analysis that’s about to get you promoted. Now, you’re thinking about presenting that information in a way that’s meaningful. There’s only one problem. You have no idea how to do it. […]