Design A Good PowerPoint Slide: Episode 4 – Emoji Bar Charts

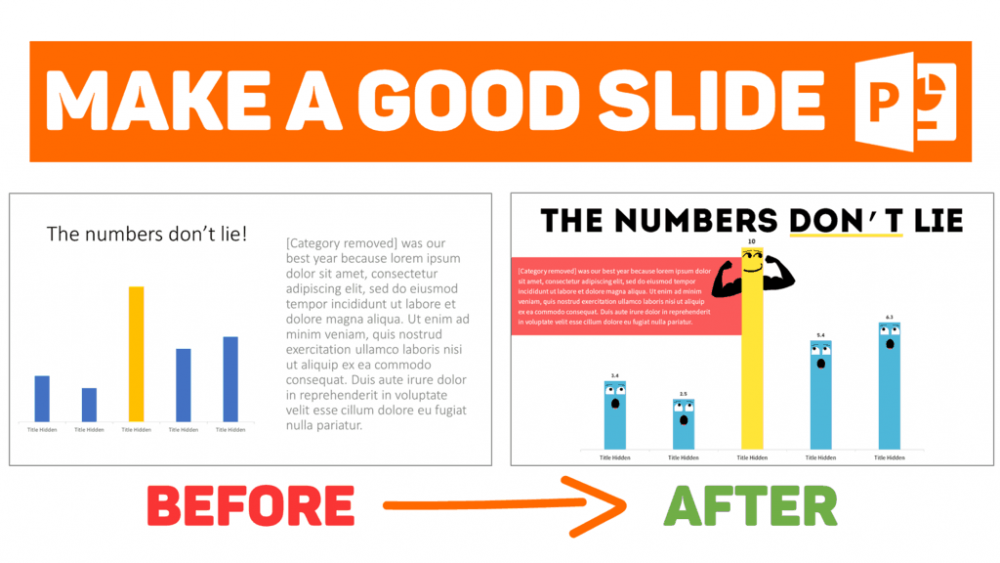
Let’s make a PowerPoint bar chart different today. And by different, I mean REALLY different. You know, by adding an emoji or two! Adding life (or, faces really) to bar charts Here’s the email I got: Dear Yoyo, I’m loving your Design A Good Slide Series! Please do mine next! I have a bar chart […]
Make a 3D Pie Chart That Actually Looks Good on PowerPoint

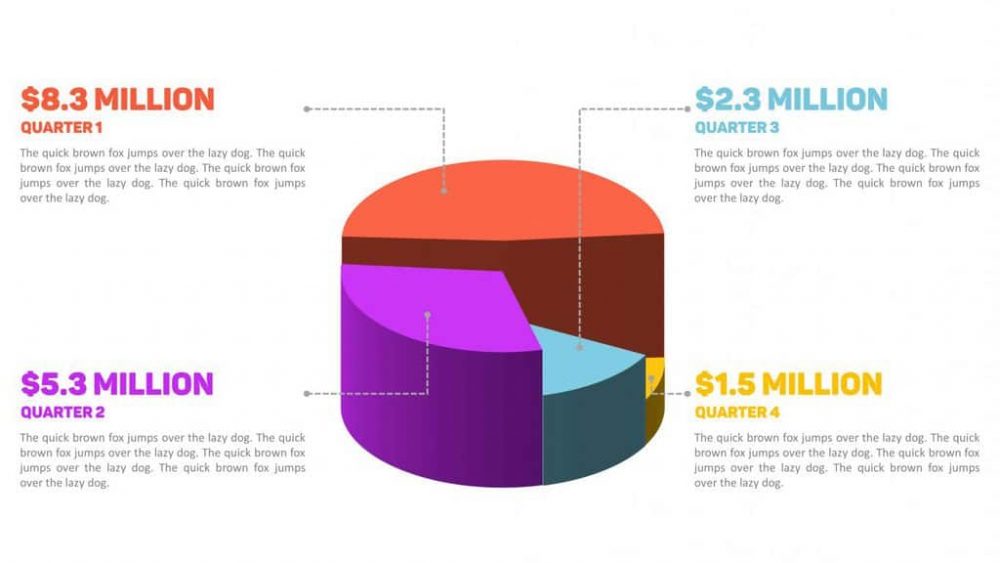
So far, Slide Cow has done two videos pertaining to charts. We have one to show you how to make an effective bar chart, and another to make an awesome looking pie chart. If you want to take it to the next level, though, you can follow this guide and make an eye-popping 3D Pie […]
How to Make Your Pie Chart Look Awesome on PowerPoint

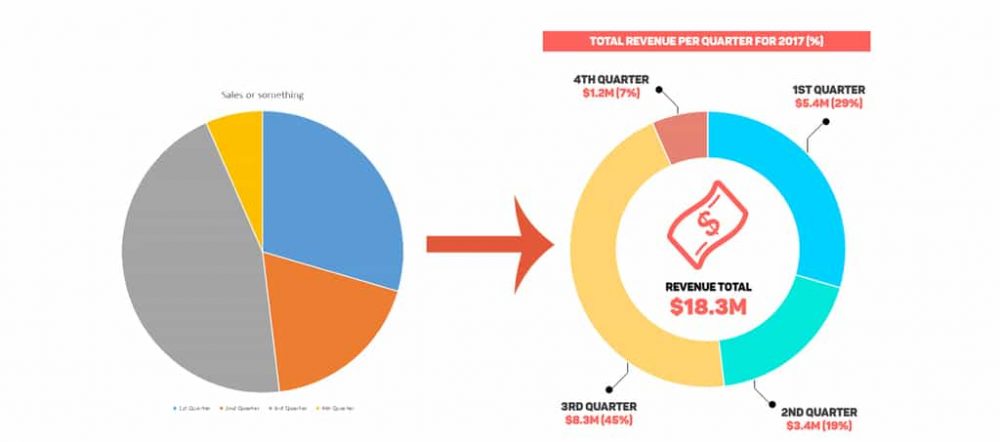
Welcome to another chapter in our PowerPoint tutorial series. Last week, we covered how you all can up your bar game by making your bar charts look awesome in PowerPoint. Following that trend, this week, we’re going to dedicate our time to the infamous pie chart. We All Hate Bland Tasting Pies, So Don’t Create A Bland […]
How to Make Your Bar Chart Look Awesome on PowerPoint

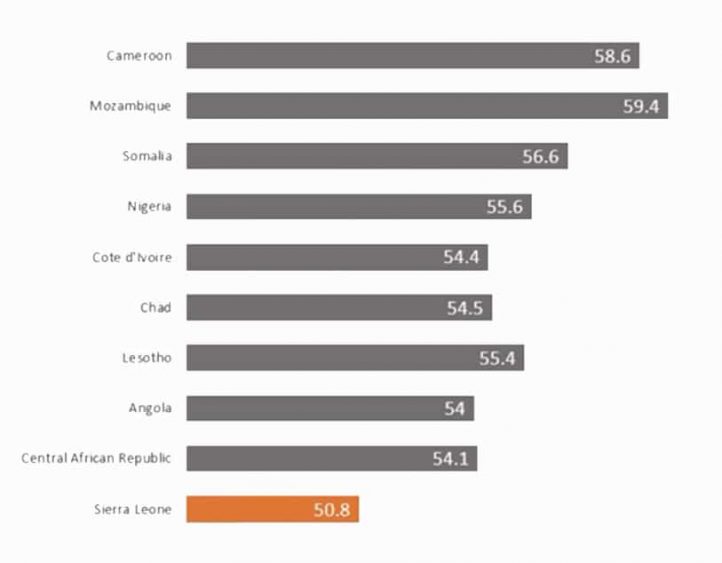
Greetings PowerPoint professionals! This week’s topic will be concerning bar charts (also known as bar graphs). You’ve seen far too many of these on various PowerPoint slides, and very few look great. Don’t worry though; Slide Cow is here to fix that. I’m Assuming You Know What a Bar Chart Is … Right? I won’t […]