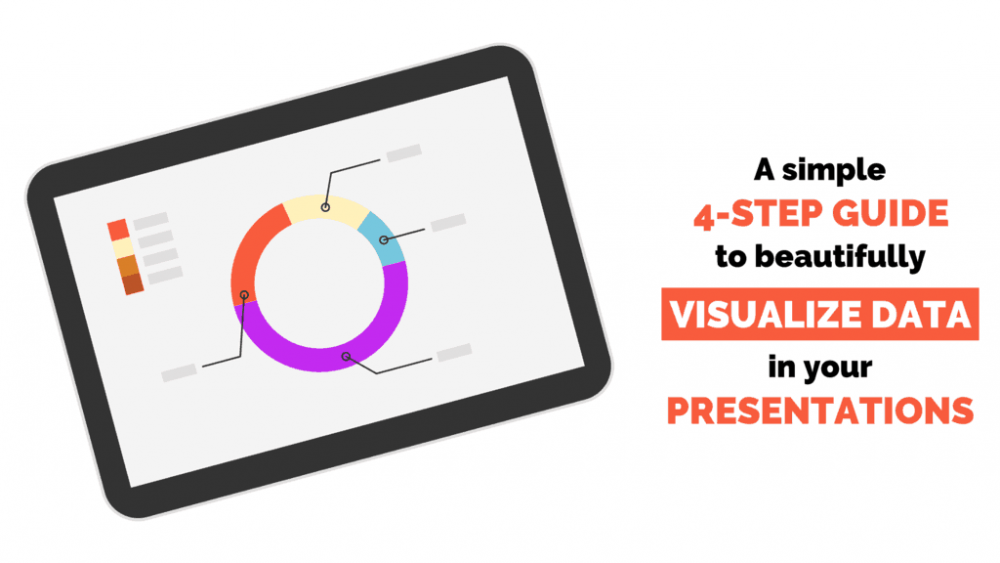
A Simple 4-Step Guide to Beautifully Visualize Data in Your Presentations
You probably already know adding illustrations to your presentation content is a great way to communicate your message in a way that is fast, easy and effective. This especially makes sense when data comes into play. After all, data is just a bunch of facts or statistics that are collected together for reference and analysis. So, […]
How to Make Your PowerPoint Charts Stand Out

In this week’s tutorial, we’re going to make your PowerPoint charts stand out and look beautiful. WHAT IS IT? This PowerPoint slide is for all those important matters. We’re going to play around with different design techniques in PowerPoint (e.g. transparency, contrast, positioning, etc.) in order to get a chart that will stand out from […]